pyNastran enables analysts using Nastran to efficiently create, manipulate, and extract data from models. It handles the underlying details so you get models that will run smoothly, without worrying about field formatting in the process.
Challenges:
- Ensuring correct field formatting
- Inefficiencies in model creation
- Organizing and analyzing large result files
Values:
- Quick verification of correct geometry
- Easy accessibility of data
- Effortless conversions to desired units
An Overview of pyNastran
pyNastran is an open source Python interface library to the various Nastran file formats (BDF, OP2, OP4) that has had continuous development since 2011. Using the BDF interface, you can read, edit, and write Nastran geometry without worrying about field formatting. pyNastran also performs multiple checks to ensure your model is correct. Using the OP2 interface, you can read large result files quickly and efficiently. Additionally, you can extract a subset of the result data and write OP2 and F06 result files.
Rather than replacing FEMAP, Simcenter3D, or PATRAN, the goal of pyNastran is to make engineers more efficient and avoid some of the common pitfalls with model creation and manipulation, as well as make it easy to extract results and put them into external programs.

In this post, pyNastran will be used to demonstrate preliminary flutter analysis of an aircraft:
- F06 Flutter plotting
- The pyNastran GUI
- Creating Animations
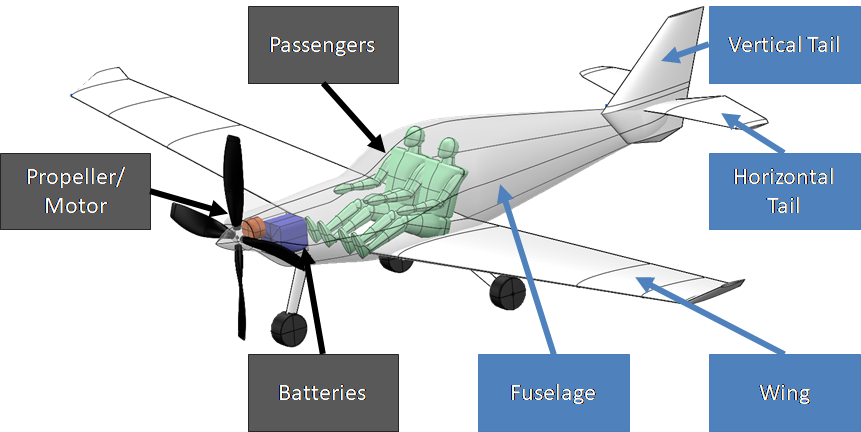
General Aviation Aircraft Example
This example is a notional two-passenger general aviation aircraft with an all-composite structure. The fuselage, wing, and tails were optimized with the propeller/motor, batteries, and passengers all modeled as non-structural (concentrated) masses.
Step 1: Loading Geometry
Once the pyNastran GUI executable has been opened, the geometry can be loaded using the File -> Load Geometry… option.
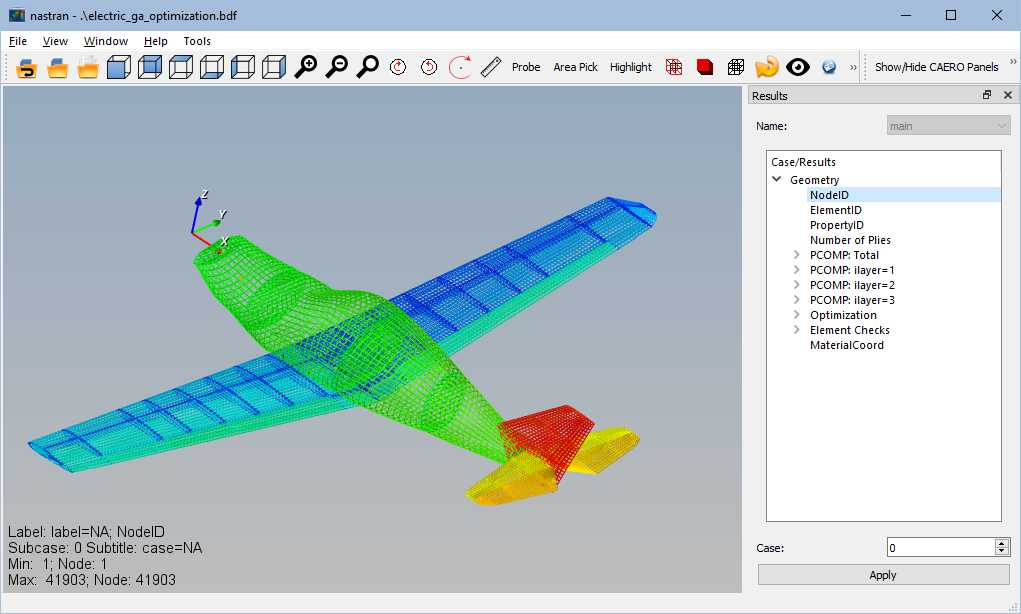
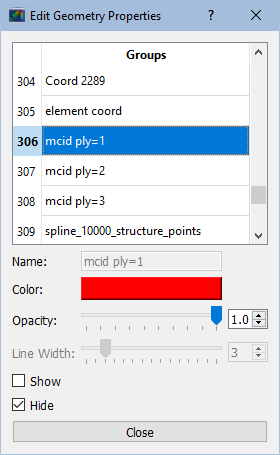
Using the View -> Edit Geometry Properties window, the opacity of the main model may also be increased to better see the internal structure.
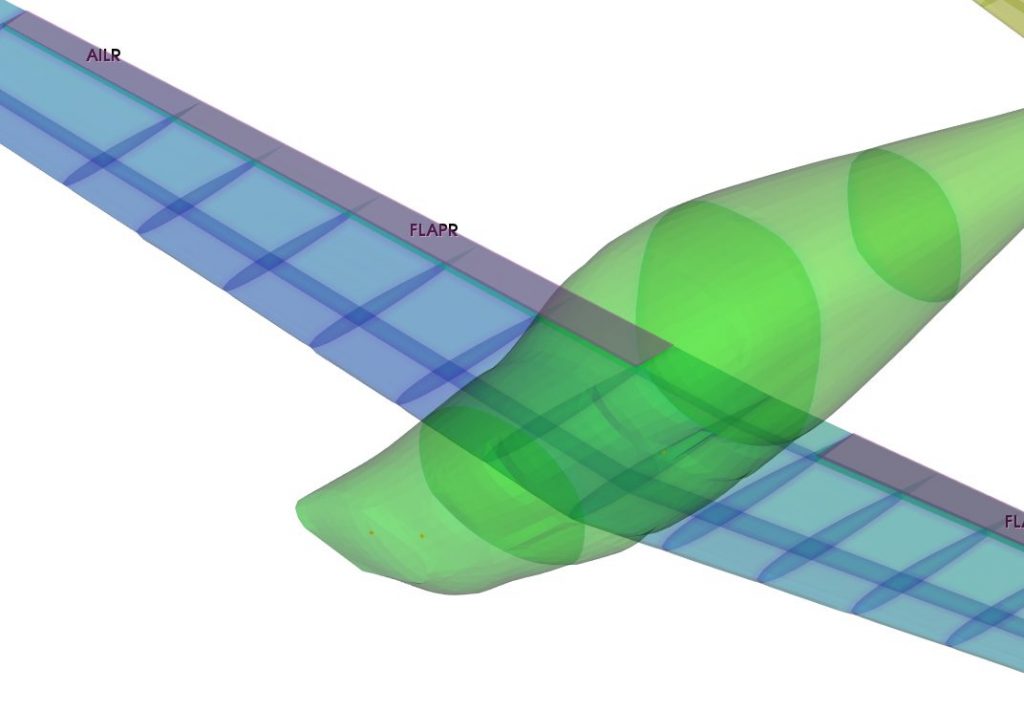
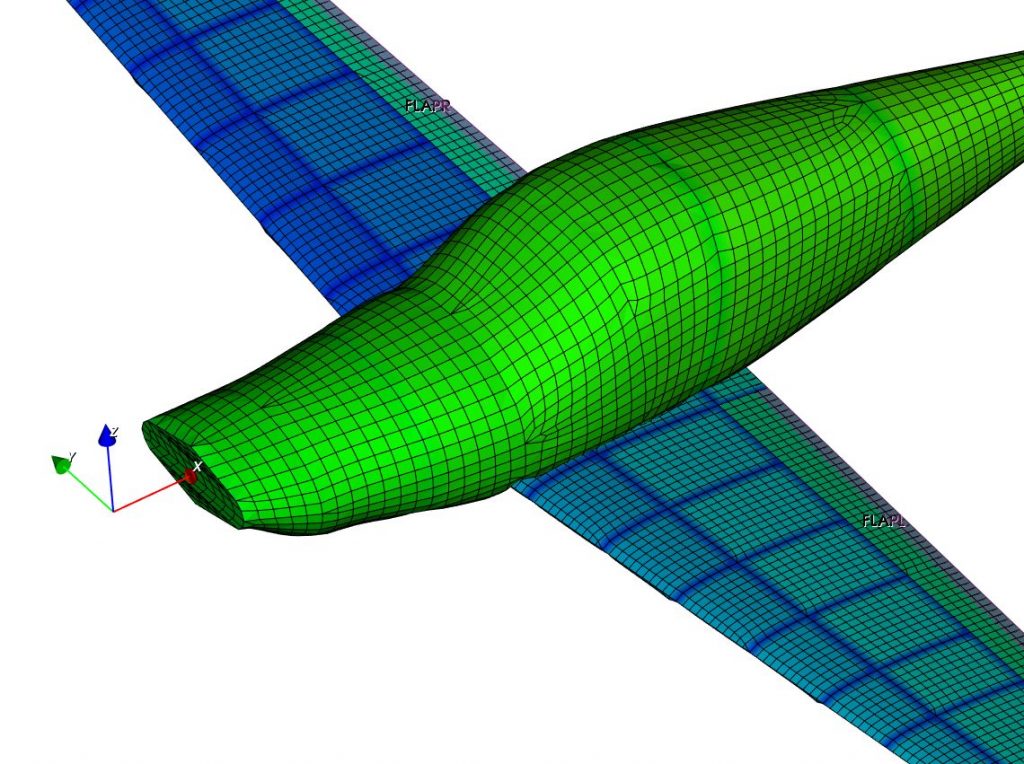
Zooming in and taking a look at the mesh with the edges (w for wireframe and e for edges or by using the ![]() and
and ![]() icons, respectively) shows a quad dominated mesh. This is important as quads are more accurate so fewer elements can be used.
icons, respectively) shows a quad dominated mesh. This is important as quads are more accurate so fewer elements can be used.
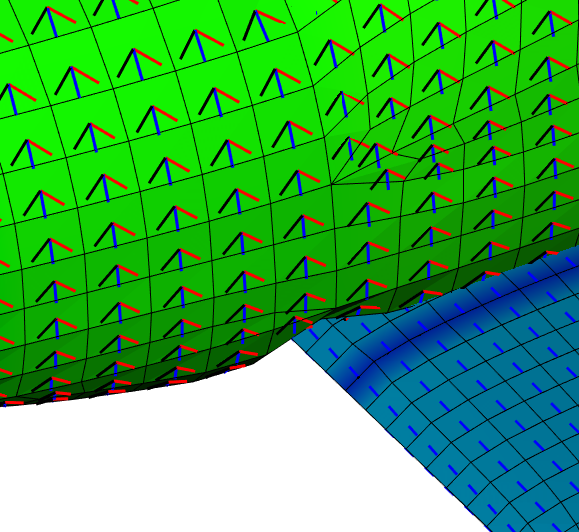
Using the View -> Edit Geometry Properties menu, we can also look at the material coordinate systems (MCID) for each layer (Layer 1-red, Layer 2-blue, Layer 3-black) in order to verify that it’s modeled as intended.
Step 2: View Flutter Results
Working with aerodynamics often involves different unit systems. With English units, aerodynamic models require the use of PARAM,WTMASS to handle the conversion of weight to mass. However, PARAM,WTMASS does not convert air density units. To address this, the pyNastran F06 plotter handles the conversion for you. The unit system for the Electric GA model is presented below.
| Type | Desired Units |
|---|---|
| PARAM, WTMASS | 1/g = 1/(12*32.2) = 0.002588 |
| Length | inches |
| Time | seconds |
| Input Velocity | inches/second |
| Weight | pounds |
| Mass | slinch |
| Structural Density | pounds/inch3 |
| Air Density | slinch/inch3 |
| Output Velocity | knots |
The flutter plotter supports a series of unit systems including:
| Unit System | Input/Output Velocity |
|---|---|
| english_in | in/sec |
| english_ft | ft/sec |
| english_kt | knots |
| SI | m/sec |
The F06 output file has velocity in units of inches/second, while it’s desired to have the velocity plotted in knots (or possibly SI). Additionally, rather than true airspeed, the equivalent airspeed will be used. Equivalent airspeed normalizes the velocity to sea level to reduce the amount of analysis required using:
Create the flutter plots by typing the following on the command line:
f06 plot_145 general_aviation_flutter.f06 –nopoints –eas –in_units english_in –out_units english_kt –modes 1:15 –rootlocus
Where:
- eas flags switches from true airspeed to equivalent airspeed
- modes 1:15 includes mode 1 to mode 15 to reduce clutter on the plot
- rootlocus adds a root locus plot of the eigenvalues
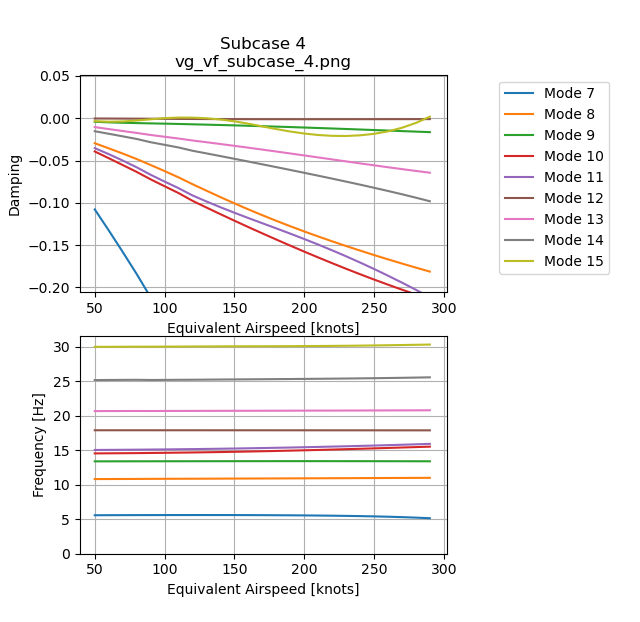
The Velocity vs. Damping (V-g) and Velocity vs. Frequency (V-f) curves are shown below. A negative damping corresponds to a stable mode, while a positive damping corresponds to an unstable mode. Another way to think about it is by asking the question: ‘How much damping is required to make the aircraft mode stable?’ While a bit difficult to see, Mode 15 is the critical flutter mode and crosses from negative to positive damping at 290 knots.
Instability can sometimes be better seen using the root locus, which occurs when there is a root in the right half plane. Here, the points grow in size as velocity increases.
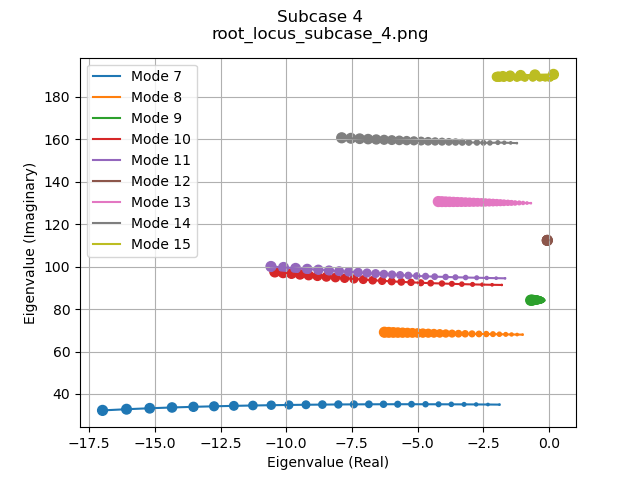
Zooming in on the plot can be accomplished by using the dynamic zooming buttons, so we can zoom in on Mode 15 to make its behavior more obvious.
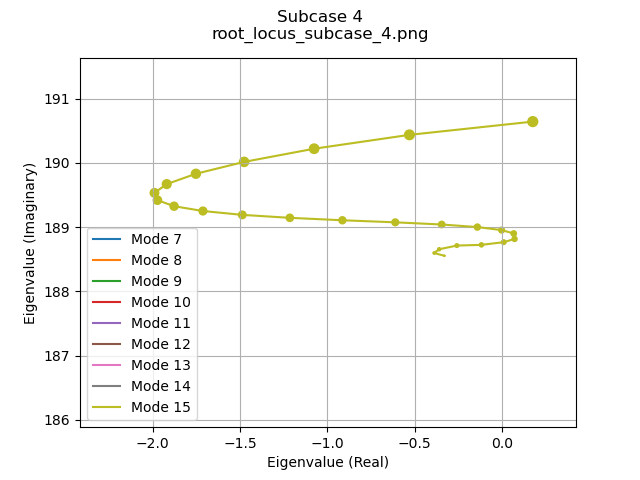
Here we see a slight hump mode instability (at imaginary eigenvalue of 188.9; roughly 125 knots), but it’s not a concern as structural damping will address this. There is a more severe instability developing as the speed (and point size) gets larger.
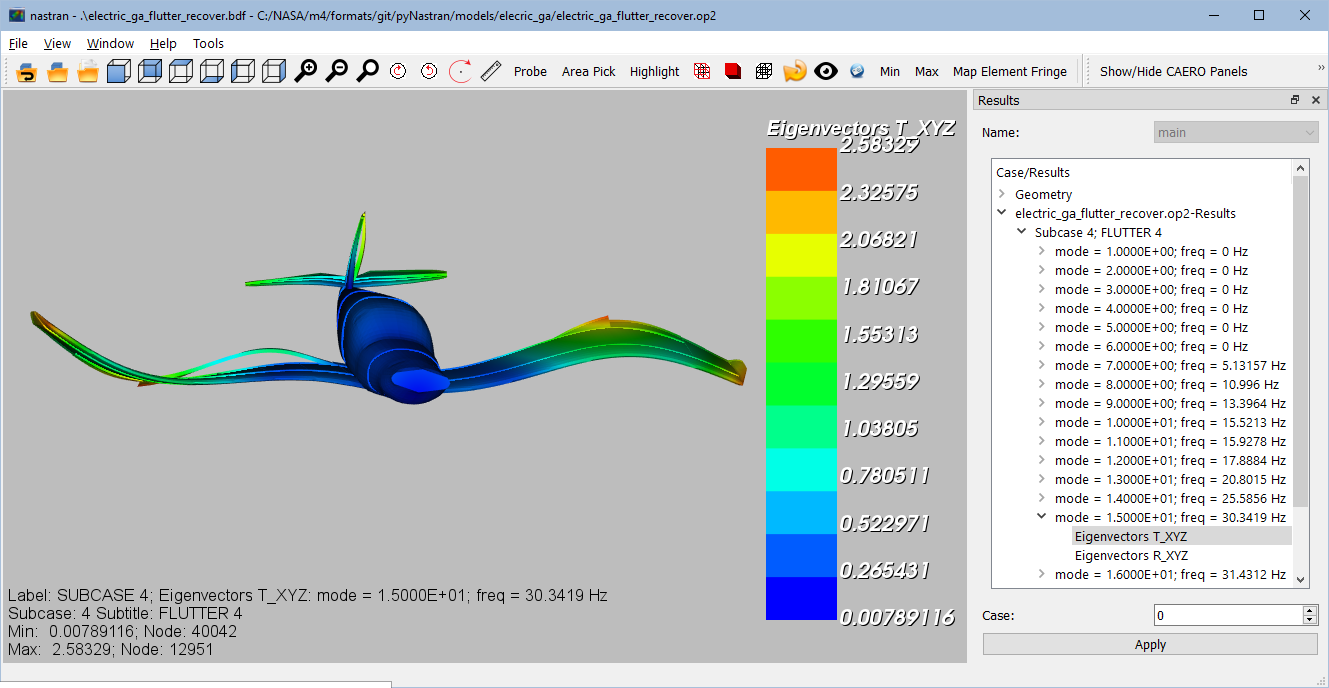
Step 3: Animating Flutter Mode Shapes
We can load the flutter result by selecting File -> Load Results… and selecting the result case from the sidebar.

Opening the View -> Create Animation… menu brings up the following menu. As this is a complex result, it’s best to set the Animation Type to Phase and click Run the animation. Update the scale, total time, frames/second as necessary to generate a smooth result.
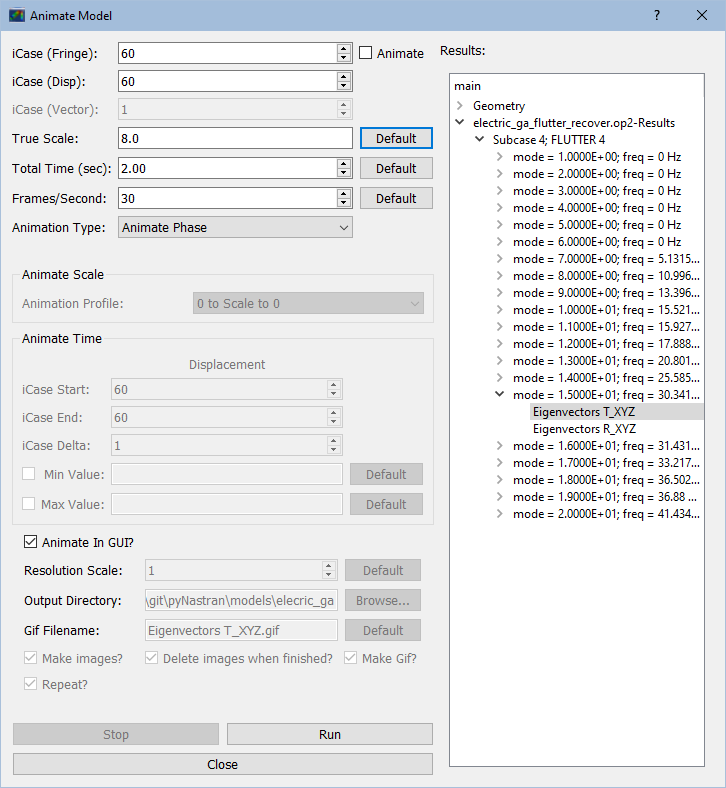
Once you are satisfied, unclick the Animate in GUI button and click Run to create an animation.
Conclusion
This post has provided a basic overview of the pyNastran GUI. The F06 flutter plotter has been shown with an emphasis on a preliminary flutter analysis of a notional general aviation aircraft.
How to Obtain pyNastran
The GUI is available for download at: https://sourceforge.net/projects/pynastran/files/?source=navbar
The source code can be found at: https://github.com/SteveDoyle2/pyNastran.
Or installed by running:
>>> pip install pyNastran
The documentation can be found at: https://pynastran-git.readthedocs.io/en/1.3/quick_start/index.html.
Note: pyNastran is an open source project; bug reports, feature requests and help with development is appreciated and encouraged 😊

Written by Steve Doyle
Steve Doyle is a Senior Aerospace Engineer with a background in structural analysis, CFD, and programming. He’s also the author of pyNastran. Outside of dorky projects, he likes to hike and rock climb!